PySPADTest
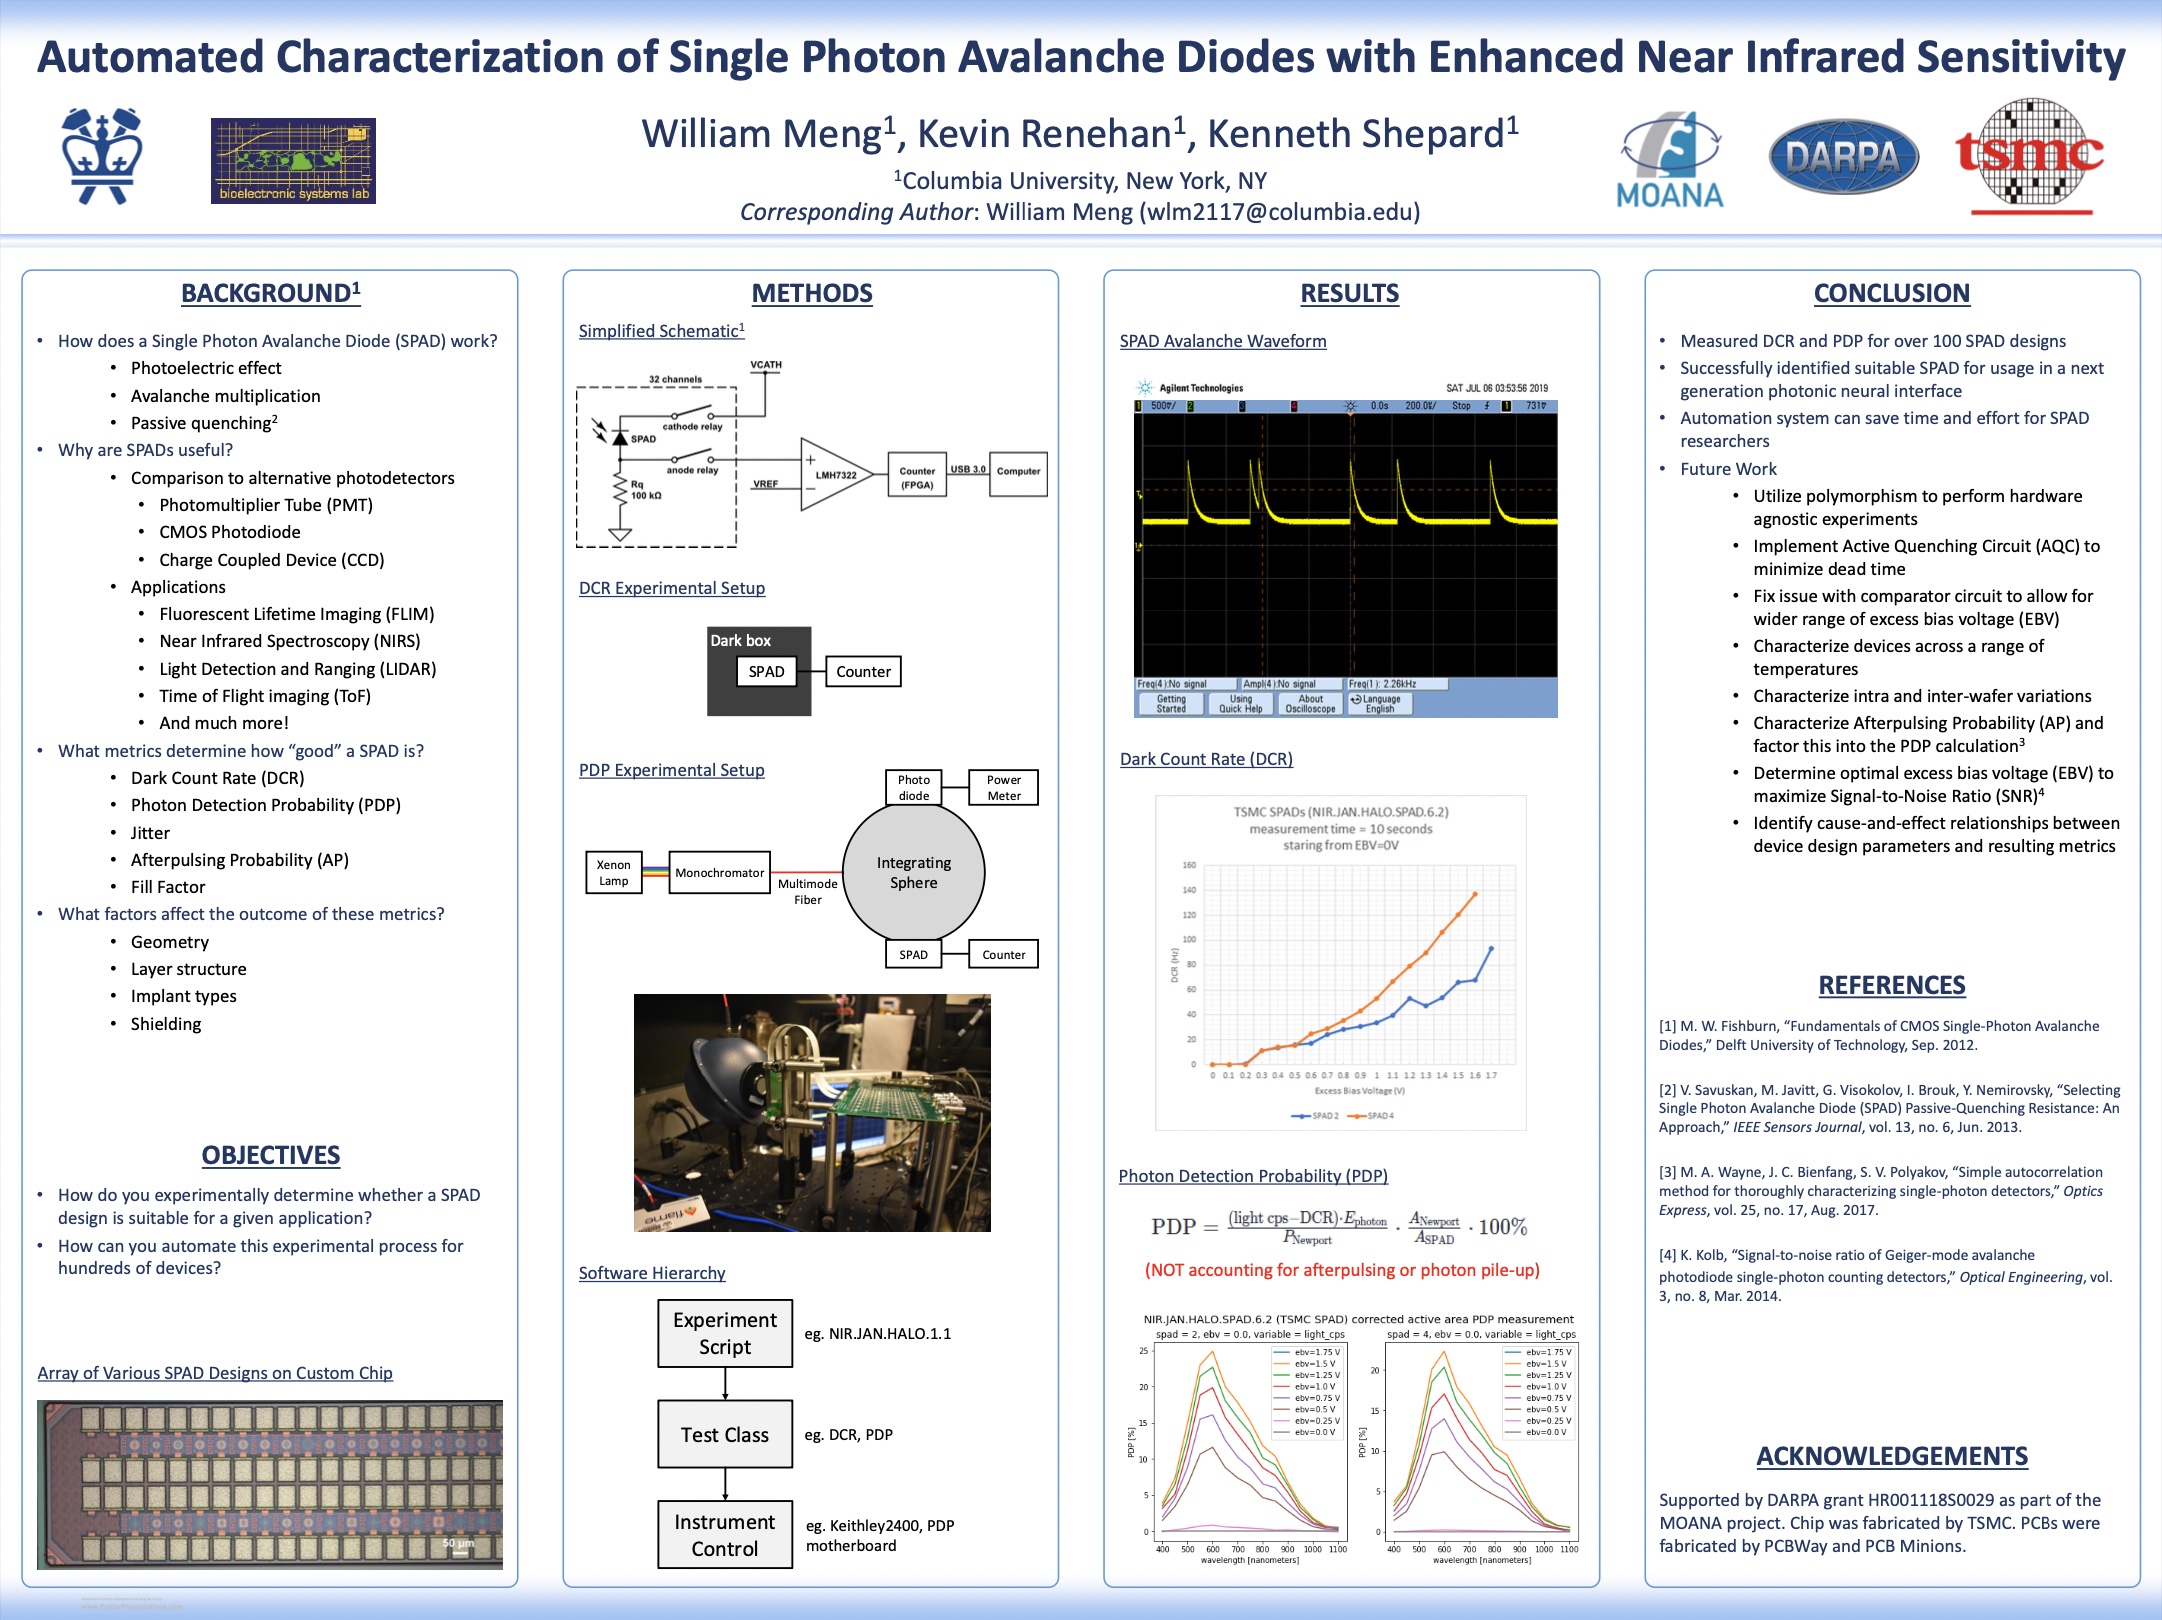
Above: My poster for Columbia’s Undergraduate Summer Research Symposium (full size PDF)
2019
Columbia University
Bioelectronic Systems Laboratory
Mentor: Kevin Renehan
I created an automated test system to efficiently characterize over a hundred Single Photon Avalanche Diode (SPAD) devices. This involved a combination of electronic & optical lab equipment, custom PCBs, and a custom Python library called PySPADTest to control everything.
The SPAD devices under test are part of a Design-of-Experiments (DOE) array (designed by Kevin Renehan) which reside in a custom fabricated chip from TSMC. The array contains over a hundred SPADs with different design parameters, but without any of the control circuits (active quench, time gating, etc) you would normally find on a SPAD imaging chip. Instead, the devices are connected to the appropriate circuits and test equipment to measure each of the following characteristics:
- IV curve — First we want to check that the device does indeed behave as a diode, then we want to determine the reverse breakdown voltage. By biasing the device in excess of the reverse breakdown voltage, it enters Geiger mode and can behave as a SPAD.
- Dark Count Rate (DCR) — Even in total darkness, a carrier will occasionally jump up into the conducting band due to thermal noise, which can trigger an unwanted avalanche. This is measured by counting the rate of avalanche events while the SPAD is placed in a dark box. DCR depends on temperature, bias voltage, and fabrication quality.
- Photon Detection Probability (PDP) — Not every photon that hits the SPAD will be converted into a photoelectron, and not every photoelectron will enter the multiplication region and trigger an avalanche. This likelihood of this occuring is PDP, essentially the discrete version of Quantum Efficiency. This is measured for one wavelength of light at a time and for various excess bias voltages. Monochromatic light is produced by filtering a Xenon lamp with a monochromator. The spatial distribution of the light is then made uniform by bouncing it around an integrating sphere. The optical flux is estimated via a reference measurement with a calibrated optical power meter.
To facilitate each measurement, the custom PCBs use shift registers activate one of 32 relays at a time to connect SPAD to a Keithley 2400 for the IV curve measurement, or a comparator and FPGA counter (with firmware written by Kevin) for the DCR and PDP tests.
Summary of my contributions:
- Wirebonding diagrams for each set of 32 SPADs to be tested.
- Design+assembly+testing of the custom multiplexer PCBs.
- Software architecture and implementation for instrument control and experiment automation.
- Measured IV curve, Dark Count Rate (DCR), and Photon Detection Probability (PDP) for >100 SPAD variations.
This automation system took a lot of time and effort to develop, but the result was well worth it. Watching the system click its relays and adjust all of the instruments automatically was like watching a ghost performing the experiments.
Many thanks to Kevin Renehan for his guidance on this project, as well as the rest of the SPAD team: Sajjad Moazeni, Eric Pollmann, Jaebin Choi, Adriaan Taal, and of course Prof. Ken Shepard.
comments powered by Disqus